The 2026 Hormuz Oil Shock: What the Price Spike Did—and Did Not Prove
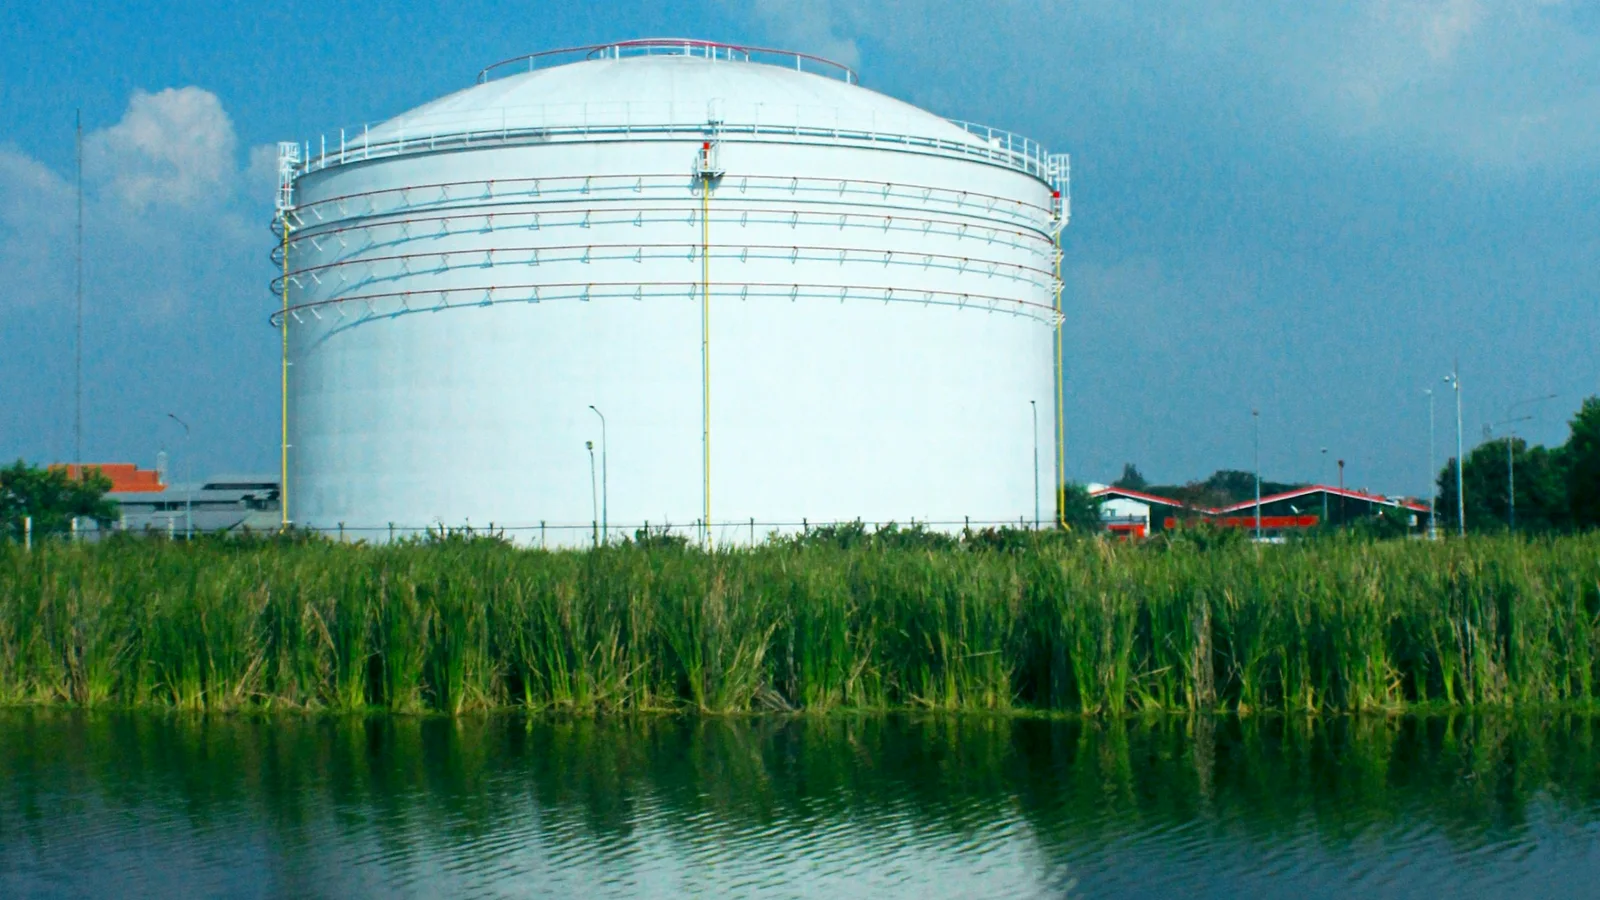
Image: Hardingferrent / Unsplash
For a few weeks in 2026, the oil market appeared to validate every apocalyptic Strait of Hormuz thread at once. Brent front-month futures rose above $100 per barrel and reached a second-quarter high of $118 on April 29. By June 26, the same contract had fallen to $72.
That range is not evidence that the disruption was fake. It is evidence that shock, duration, and clearing price are different questions.
What the EIA observed
The U.S. Energy Information Administration’s July review described disrupted crude and petroleum-product flows through the Strait of Hormuz, shut-in Middle Eastern production, buyers searching for alternative supplies, and stronger U.S. refinery margins, production, and exports.
Its July Short-Term Energy Outlook estimated that global crude inventories declined by an average 5.1 million barrels per day during the second quarter. That estimate documents a very tight physical period. It does not say the maximum disruption continued unchanged through the rest of the year.
Markets reprice the path ahead. A barrel lost today can move price sharply; a belief that routes, production, demand, or inventories will adjust tomorrow can pull it back.
Four layers of an oil-shock claim
When a headline says “Hormuz closed” or “oil supply collapsed,” separate these layers:
- Transit: Which ships and products are delayed or rerouted?
- Production: Which fields are actually shut in, and for how long?
- Inventory: Who is drawing stocks, and where are those stocks located?
- Demand response: Are refiners, airlines, drivers, and industry changing behavior?
A shipping interruption is not automatically the same number as lost global consumption. Alternative routes have limits, inventories are finite, and demand response is uneven—but all three affect the market-clearing price.
Why the peak is a dangerous anchor
The most clickable argument compares every later price with the crisis high and declares either manipulation or permanent scarcity. Both are lazy. The high reflected information and fear available at that moment. The decline reflected new information, adaptation, profit-taking, and changed expectations.
The reverse mistake is equally bad: because price retreated, the disruption did not matter. EIA’s flow and inventory analysis contradicts that dismissal.
A live checklist for the next shock
- Timestamp every price and forecast.
- Prefer vessel flows, production estimates, refinery runs, and inventories to anonymous claims.
- Distinguish Brent from WTI and spot from futures.
- Note whether a figure is observed, estimated, or forecast.
- Re-run the thesis under shorter and longer disruption windows.
Most importantly, do not compare a forecast published before the event with an observed price during it and call the difference a forecasting failure. Forecasts are conditional snapshots.
Sources and limits
- EIA: Petroleum markets responded to disruptions in the Middle East in the second quarter
- EIA: July 2026 Short-Term Energy Outlook
- EIA: Analysis and projections
EIA estimates can be revised as better data arrives. This article is educational and is not trading or investment advice.
Key takeaway
The 2026 episode proved that Hormuz disruption can hit physical flows and prices hard. It also proved that the crisis peak is not a permanent forecast. Follow the barrels, inventories, and timestamps—not the loudest chart.
Strait of HormuzBrentoil shockEIA2026